Monitoring application performance has always been a crucial aspect of software development. However, with the rise of distributed systems and cloud-native architectures, it has become increasingly challenging. The complexity of modern software systems has made it difficult to collect and analyze telemetry data effectively. This has led to a growing need for a standardized observability framework that can provide deep insights into system behavior. This is where OpenTelemetry comes into play.
OpenTelemetry is a rapidly growing open-source project that has gained significant traction from major industry players such as Microsoft, Splunk, and Amazon, signaling the increasing demand for a standardized approach to cloud-native observability.
In this blog, we'll take a deep dive into OpenTelemetry, exploring its capabilities, benefits, and the current landscape of observability tools and frameworks. We'll examine how OpenTelemetry can help you gain a better understanding of your system's behavior, diagnose issues, and optimize performance.
What is OpenTelemetry?
OpenTelemetry (also referred as OTel) is a powerful open-source observability framework designed to help developers gain deep insights into their system's behavior. It provides a set of APIs and SDKs that allow developers to collect telemetry data (metrics, traces, and logs) from their applications and infrastructure. The framework supports a wide range of programming languages, making it easy to adopt across different stacks and environments.
The framework is highly flexible and can be easily integrated into various programming languages and environments, making it ideal for developers of all skill levels. It also allows developers to collect telemetry data from various sources, including containers, microservices, serverless functions, and distributed systems. With OpenTelemetry, developers can gain a unified view of their systems, identify issues and performance bottlenecks, and quickly resolve them before they affect end-users.
OpenTelemetry was created as a merger of two popular observability projects, OpenCensus and OpenTracing, with the goal of providing a single standard for instrumentation and data collection in the observability space. By providing a common set of APIs and data formats, OpenTelemetry aims to reduce fragmentation in the observability landscape and make it easier for developers to integrate with various observability tools.
What is Telemetry Data?
Telemetry data is the lifeblood of observability, providing valuable insights into the behavior and performance of your systems. It encompasses a wide range of data points, including metrics, traces, logs, and other contextual information that collectively paint a holistic picture of your application's health and operational characteristics.
Let's dive into the key components of telemetry data and how they work together to deliver valuable insights:

Image source: Dynatrace
1. Metrics: Metrics are quantitative measurements that capture specific aspects of your system's behavior, such as response time, CPU utilization, or error rates. They help you understand the overall performance and resource utilization of your application. Think of metrics as the vital signs that indicate the health of your system, enabling you to identify bottlenecks, optimize resource allocation, and monitor trends over time.
2. Traces: Traces provide a detailed record of the journey of a request as it flows through your distributed system. They capture information about each step, such as service calls, database queries, and external API invocations, along with their timing and contextual metadata. Traces allow you to visualize the end-to-end flow of requests, identify latency bottlenecks, and pinpoint the root causes of performance issues.
3. Logs: Logs are textual records of events and activities within your application. They capture valuable information about system behavior, error messages, warnings, and other relevant events. Logs provide a detailed narrative of what happened within your system, helping you troubleshoot issues, track user interactions, and gain insights into system behavior during specific events.
4. Contextual Information: In addition to metrics, traces, and logs, telemetry data also includes contextual information that adds meaning and context to the collected data. This can include metadata about the environment, user interactions, request parameters, or any other relevant contextual details that help you understand the circumstances surrounding a specific event or observation.
How does OpenTelemetry Work?
OpenTelemetry is a flexible tool for monitoring your applications and infrastructure. It's made up of several key components (such as APIs and SDKs) each designed to work together seamlessly and help you gain insight into how your systems are performing.
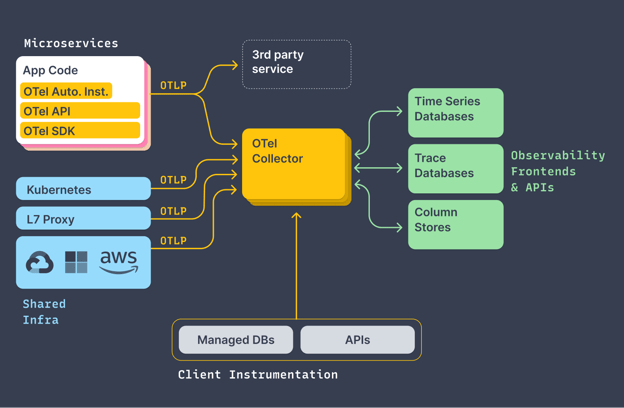
But how do these components work together in practice? Let's dive deeper into OpenTelemetry's architecture to see how it simplifies observability:

Image source: OpenTelemetry
At the core of OpenTelemetry is the API. This is what allows your applications to communicate with OpenTelemetry and provide data on performance metrics, tracing, and more. The API is language-specific, meaning that you can choose the one that matches the language your code is written in. This means you can start gathering telemetry data with minimal disruption to your existing codebase.
Once you've instrumented your code with the API, you'll need a Software development kit (SDK) to gather, translate, and send the data to the next stage. SDKs are the bridge between your code and the OpenTelemetry Collector, which is responsible for processing and exporting the data to your desired backend.
The Collector is the central hub of OpenTelemetry which receives, processes, and exports telemetry data from a variety of sources. It is designed to be universal, allowing it to work with multiple observability backends, including Prometheus, OTLP, Jaeger, and more. The Collector can filter and process your data before exporting it, making it a highly customizable solution for your monitoring needs.
The Collector has three main components:
- Receiver: The receiver defines how data is gathered. It can either push the data to the Collector during regular intervals or pull it only when queried. If needed, the receiver can gather data from multiple sources.
- Processor: The processor performs intermediary operations that prepare the data for exporting, such as batching and adding metadata. It ensures that the telemetry data is clean, organized, and enriched before being sent to the backend.
- Exporter: The exporter sends the telemetry data to an open-source or commercial backend, depending on what the user has specified. Like the receiver, the exporter can push or pull data.
With OpenTelemetry's loosely coupled components, you have the freedom to choose which parts of OTel you want to integrate. This gives you the flexibility to implement observability in a way that best fits your organization's needs.
Benefits of OpenTelemetry
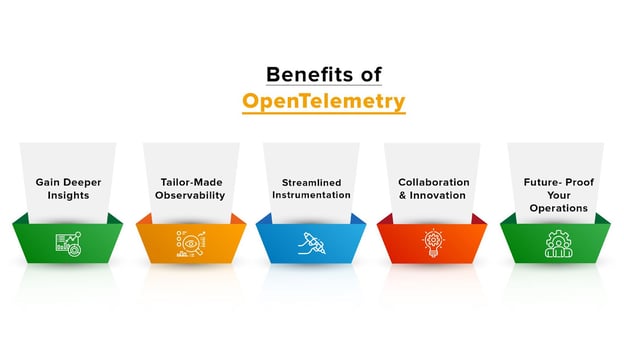
- Gain Deeper Insights: OpenTelemetry serves as your gateway to unlocking a new level of understanding and control over your applications. With its comprehensive suite of tools and technologies, OpenTelemetry empowers you to dive deep into the intricacies of your systems. It enables you to identify and troubleshoot issues quickly, improving your overall application reliability.
- Tailor-Made Observability: One size doesn't fit all when it comes to observability. OpenTelemetry recognizes this and offers unparalleled flexibility to customize your observability stack. Whether you operate in cloud-native environments, on-premises infrastructure, or hybrid setups, OpenTelemetry seamlessly integrates with your existing ecosystem. It enables you to choose the best-in-class monitoring solutions that align with your specific needs, while providing the necessary bridges to bring everything together under one unified umbrella.

- Streamlined Instrumentation: OpenTelemetry simplifies the process of instrumenting your applications by providing easy-to-use APIs and SDKs. It automates much of the heavy lifting, allowing you to focus on delivering exceptional user experiences rather than spending excessive time on manual code modifications. OpenTelemetry's instrumentation capabilities ensure that you can capture the necessary telemetry data with minimal effort.
- Collaboration and Innovation: OpenTelemetry is more than just a technology; it's a thriving ecosystem built on collaboration and innovation. By adopting OpenTelemetry, you become part of a vibrant community of developers, engineers, and industry experts who share a common goal of advancing observability practices. This collaborative spirit fosters the exchange of knowledge, best practices, and real-world experiences, empowering you to drive continuous improvement within your organization.
- Future-Proof Your Operations: In a rapidly evolving digital landscape, future-proofing your operations is paramount. OpenTelemetry is designed with longevity in mind. By embracing open standards, adhering to industry best practices, and adapting to emerging technologies, OpenTelemetry ensures that your observability capabilities remain robust and adaptable to the changing needs of your business.
The Next Frontier in Application Monitoring
OpenTelemetry stands as a pivotal solution that addresses the critical need for efficient and comprehensive observability in modern IT environments. By offering a range of powerful tools, APIs, and SDKs, OpenTelemetry empowers organizations to unlock invaluable insights into their system's behavior and performance, empowering them to make data-driven decisions and optimize their applications effectively.
OpenTelemetry offers immense potential for transforming your observability capabilities. However, navigating its implementation and maximizing its benefits can be complex. That's where Daffodil can help you.
Our seasoned professionals are well-versed in OpenTelemetry and can provide invaluable guidance and support throughout your journey. Whether you need assistance with setting up and configuring OpenTelemetry, integrating it into your existing systems, or optimizing its usage for specific use cases, our experts have the knowledge and experience to help. Book a free consultation!


